biotaphy.github.io
Web Client
The BiotaPhy web client allows users to submit single or multi-species experiments via a web UI. It is intended for smaller projects (less than 1000 species) and our standard climate data. For larger experiments, or for assistance with Metacommunity Phylogenetic Analysis (MCPA), contact us.
Table of Contents
Authenticate
If you want to perform anything more than a small demo experiment, you will want to sign up for an account. Do thatby clicking the sign up link under the login box on the left side of the page. It may take a few seconds for the page to load as it is checking for available data packages that you may have already submitted as well as public data.
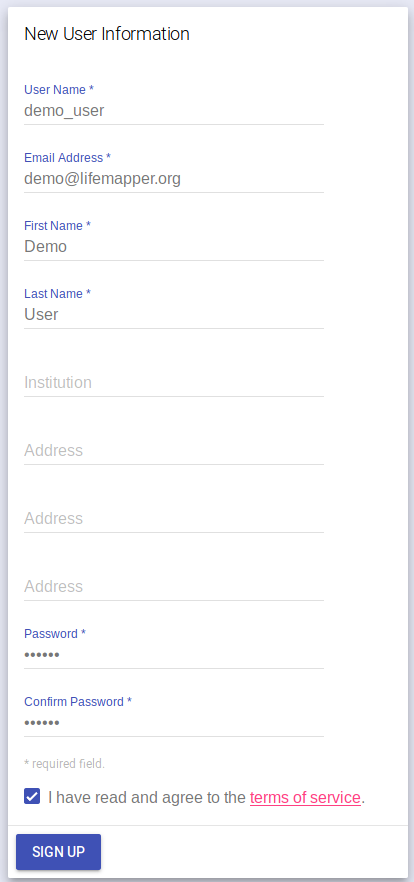
Fill in the new user form and click “SIGN UP”. You will then be authenticated with your new user account. Your user name will appear in the left side bar.
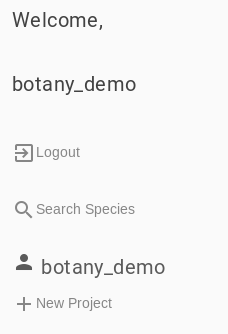
New Project
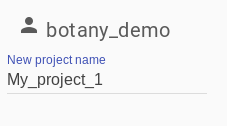
After you have authenticated, or if you just want to try a small project, click the link called “+ New Project” in the left-side pane. You will be presented with the input tabs for your new project. You will need to give your new project a name and we recommend that you do that first. You can do that in the left side bar under “New project name”.
At this time, the the only workflow available through the web UI is one starting at Species Distribution Models and optionally performing multi-species statistical analyses. Follow the following steps:
If you want to perform multi-species analyses, you may want to provide a phylogenetic tree. If you want to perform MCPA, you will need to provide a tree and biogeographic hypotheses.
Finally, you will want to Submit your project
Occurrence Data
Click on the “SPECIES DATA” tab. There are four options for providing occurrence data. You can
- provide a list of species
- select species from a taxon tree
- select existing occurrence data from GBIF
- upload your own occurrence CSV file
Occurrence Data - Species List
If you want to provide a list of species and have occurrence data retrieved from iDigBio, from the “SPECIES DATA” tab, select the “List of Species” radio button. This is the default option and you will be presented with a text box that you can enter species names into, one per line.

Input your species names and then click the “Match” button. A query will be performed to GBIF, iDigBio and Open Tree of Life to find available data.
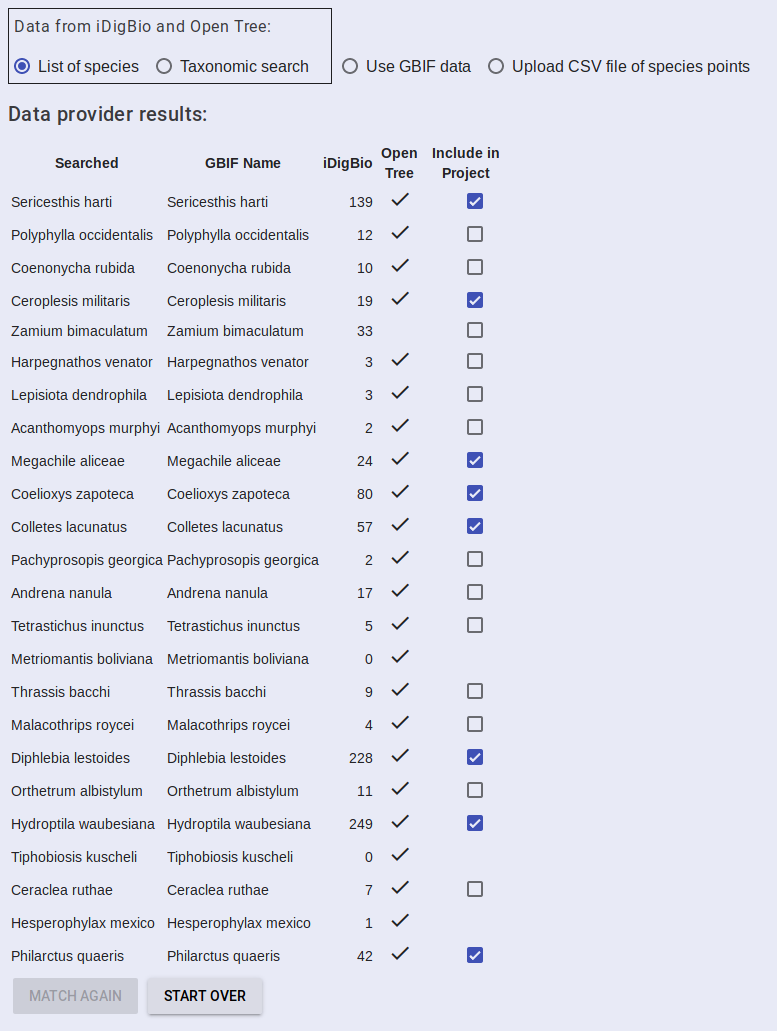
The results will be returned in a table showing the search string you provided, the matching GBIF accepted name, how many occurrence points were found in iDigBio, whether the taxon was found in Open Tree, and an option to include the data in the project or not. Select the data you want to include and then proceed to Add Algorithms.
Occurrence Data - Taxon Tree
If you want to select several taxa from the same group, you can do that from the taxon tree interface. From the “SPECIES DATA” tab, select the “Taxonomic Search” radio button. This search will let you drill down through the taxonomic information that Lifemapper has from a cache of the GBIF taxonomy.
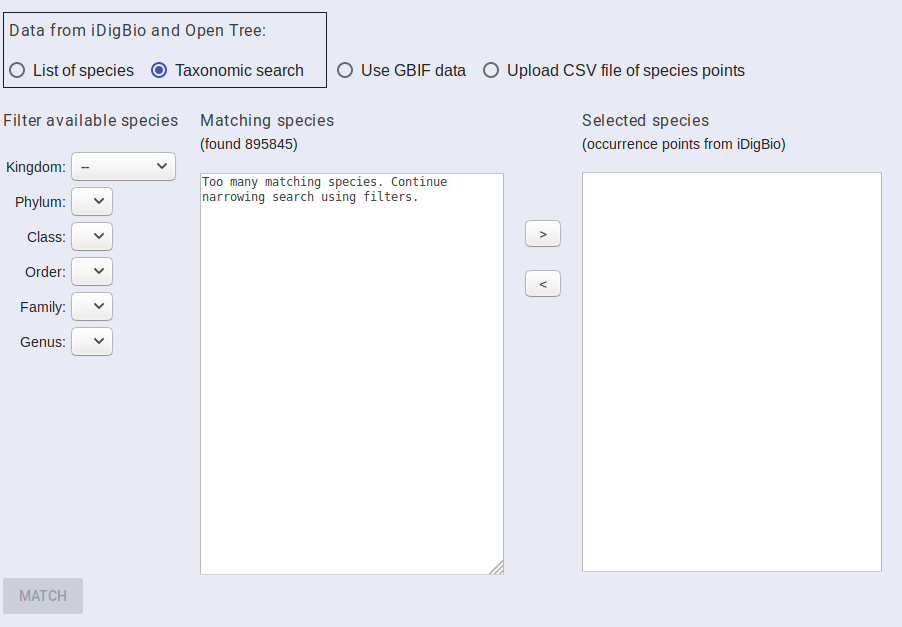
Start with Kingdom and pick the taxonomic group you are interested in. It may take a few seconds to update the UI between selections. Once your query matches a small enough subset of taxa, they will be displayed in the matching species box. Select the species that you want to include in your project and then click the “>” button to move them to the selected species box. Continue to select species until you have all of the species you wish to include in the selected species box. You can move species out of the selected species by clicking them and then the “<” button.
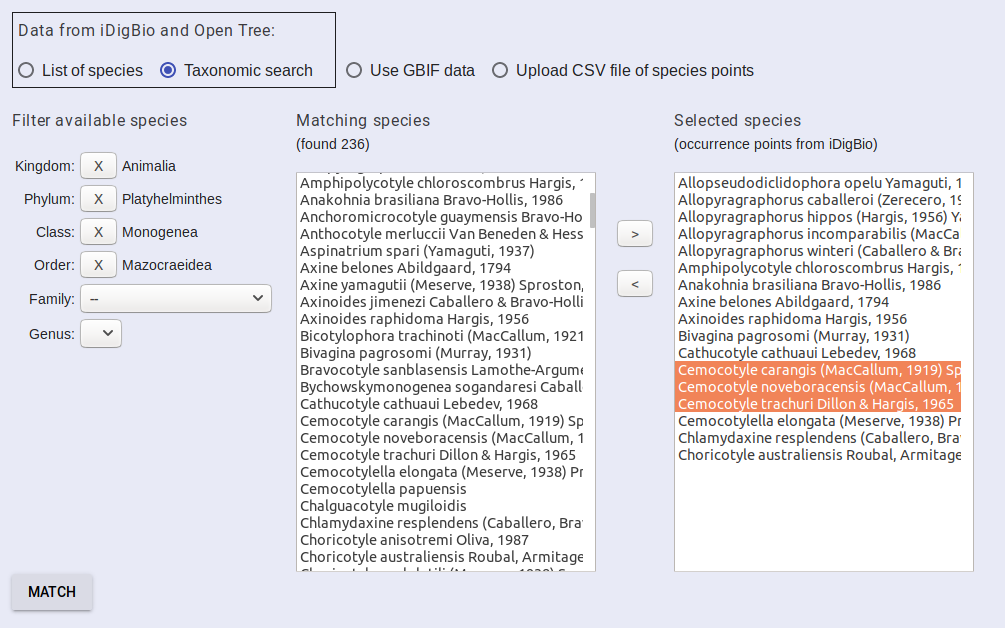
When you have selected all of your species, click match.
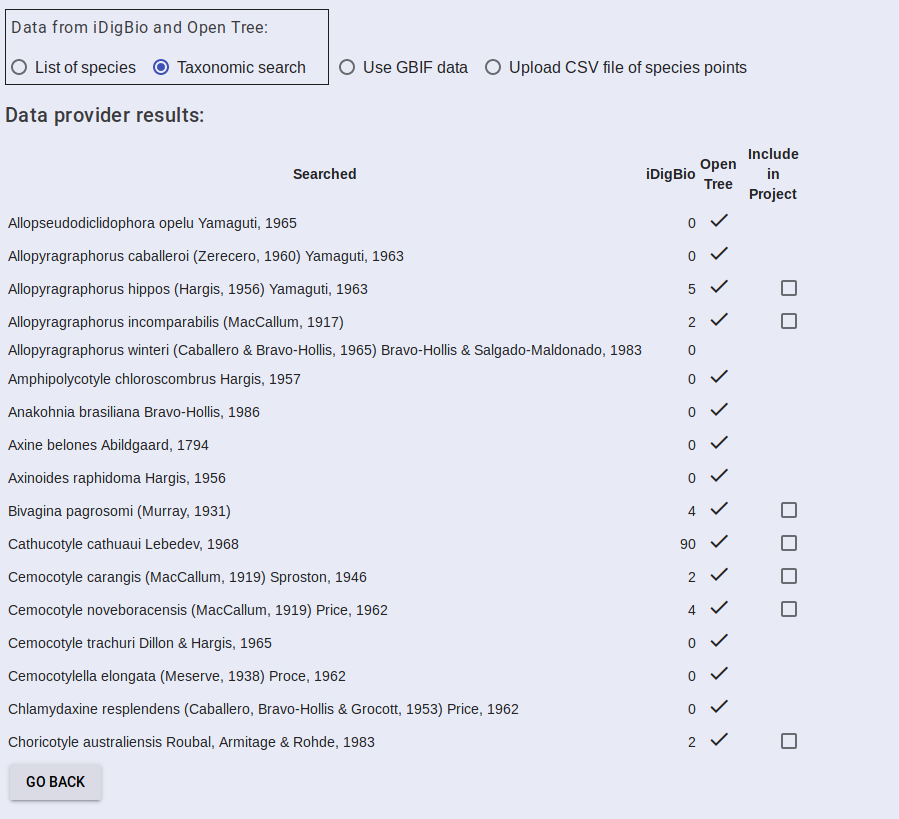
The results will be returned in a table showing the taxon string, how many occurrence points were found in iDigBio, whether the taxon was found in Open Tree, and an option to include the data in the project or not. Select the data you want to include and then proceed to Add Algorithms.
Occurrence Data - GBIF
You can view and use data from GBIF that BiotaPhy has already acquired. To do so, select the “Use GBIF data” radio button under the “SPECIES DATA” tab. You will be presented with a search field. Start typing the name of a species that you are interested in and matching taxa will be autocompleted after you type the first few characters.
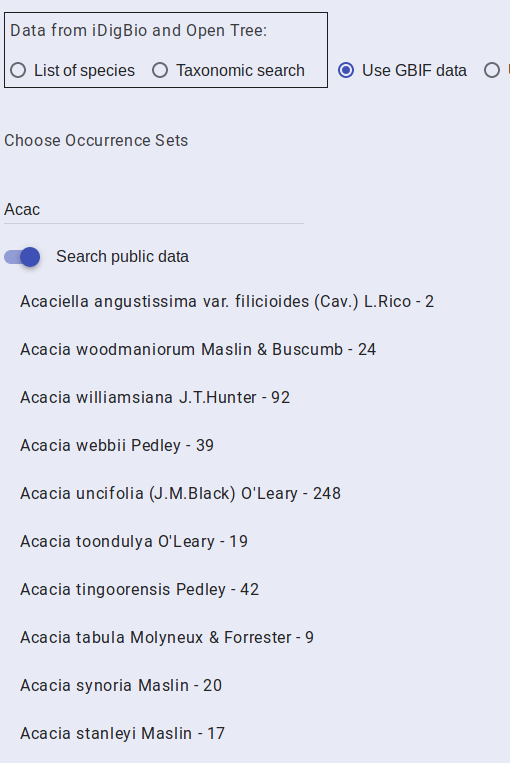
Only the first few matches are displayed so some species may require you to enter more of the species name than others. Once the species you are interested in is in the matches, select it.
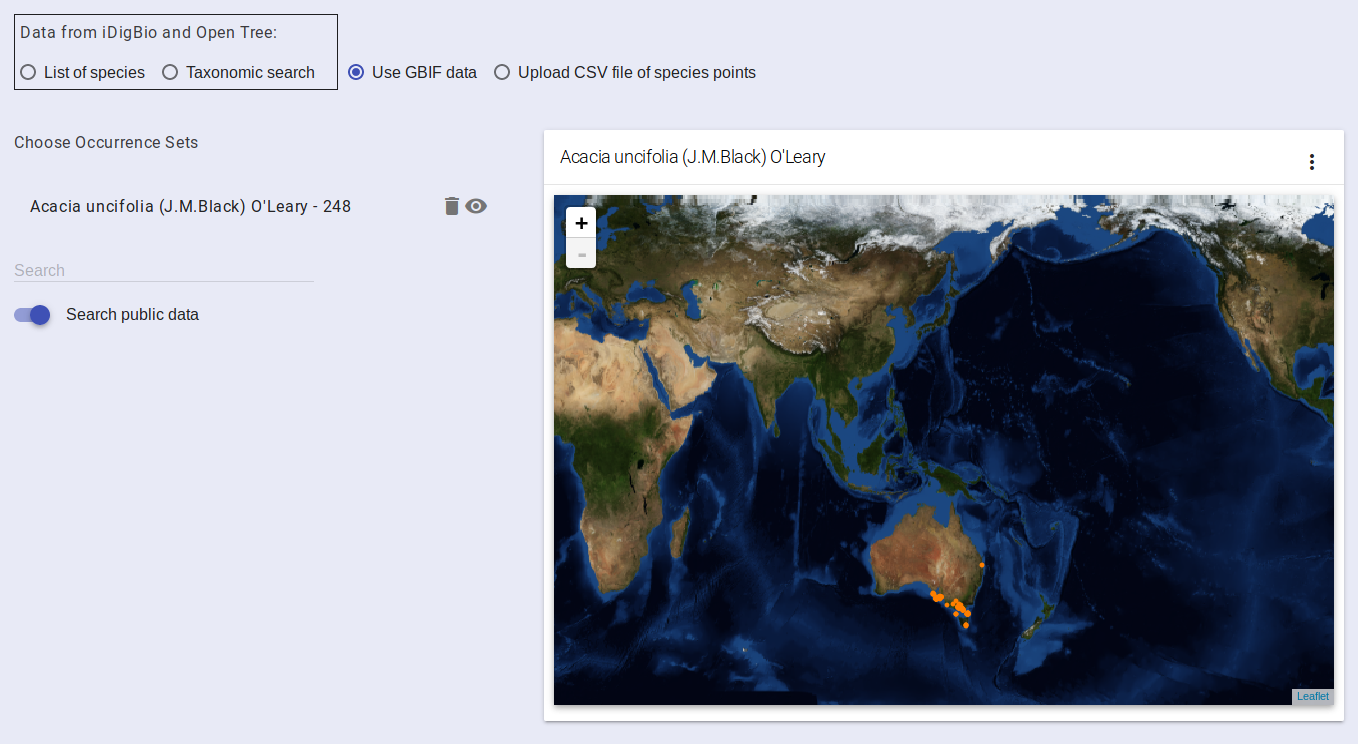
After selecting a species, the map on the right will be updated to include the occurrence points for that species. You can then perform the search again to add more species to your project. You can remove a species by clicking on the trash can icon. If you have selected multiple species, the eye icon controls which species is displayed on the map.
Select the species you wish to include and then proceed to Add Algorithms.
Occurrence Data - Upload
You can upload your occurrence data via the “Upload CSV file of species points” radio button on the “SPECIES DATA” tab.

Browse to the CSV file you want to upload and select it.
The UI will read the headers of your CSV file and present you with options for defining each column. Select the appropriate options for your CSV. Note that you must indicate that one column as “Taxon” for you species name column. One must be selected as “Longitude” and finally one must be “Latitude”. You can change the name of your file if you wish and select upload
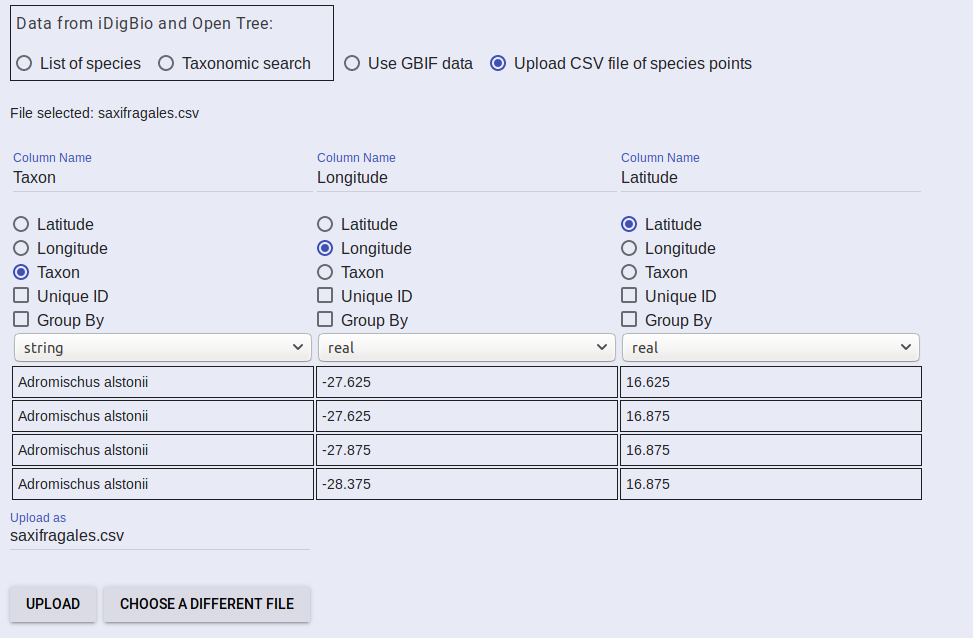
Your file will be sent to the server and a progress bar will be displayed. Once the file is successfully uploaded, a message indicating that will be displayed. After that appears, proceed to Add Algorithms.
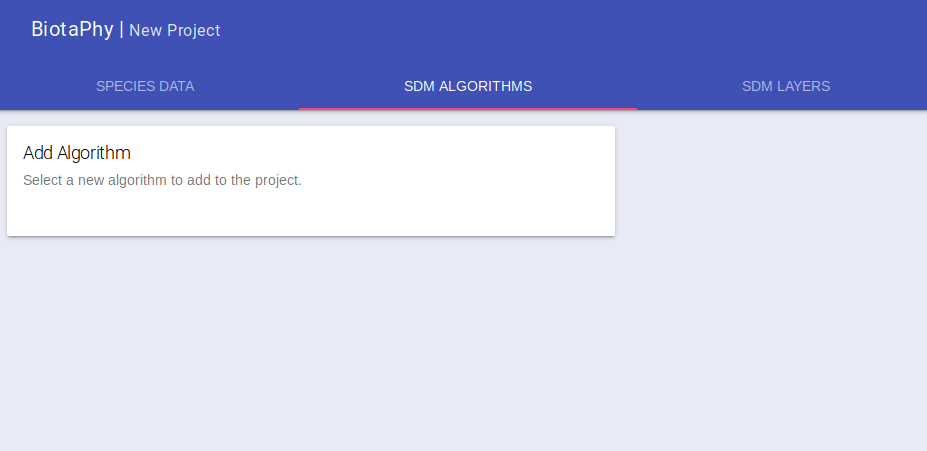
Add Algorithms
Click on the “SDM ALGORITHMS” tab, you can select one or more algorithms for your project, if you are wanting to run multispecies analyses, we recommend just selecting one. Hover over the “Add Algorithm” card and select the algorithm you want.
The card will be updated with the default algorithm parameters which you can change as needed.
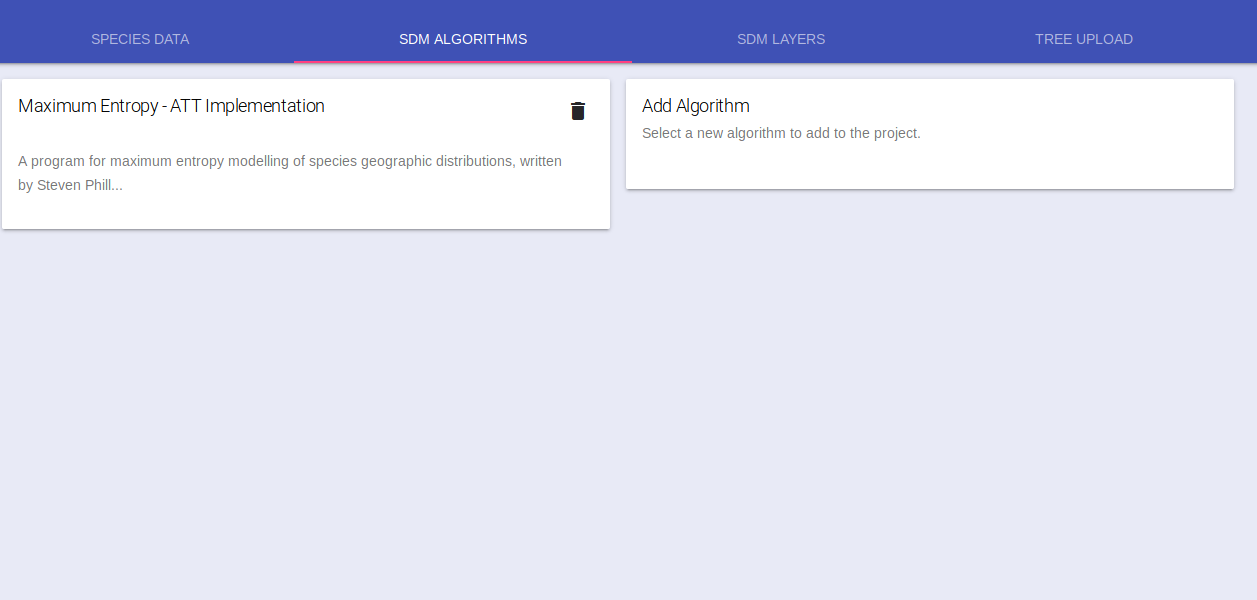
Add additional algorithms if you wish and move on to Select Climate Data.
Select Climate Data
The “SDM Layers” tab displays the available climate data you can use for your models. Each card represents a package of scenarios and will allow you to select the climate scenarios to be used for creating Species Distribution Models. The radio buttons represent the scenario used for creating the model ruleset. Select one of these radio buttons. You have the option to select one or more climate scenarios to project the model ruleset. Select the check box by each of the scenarios you wish to use for projections, the model scenario is already selected. For multi-species analyses, only the model scenario will be used.
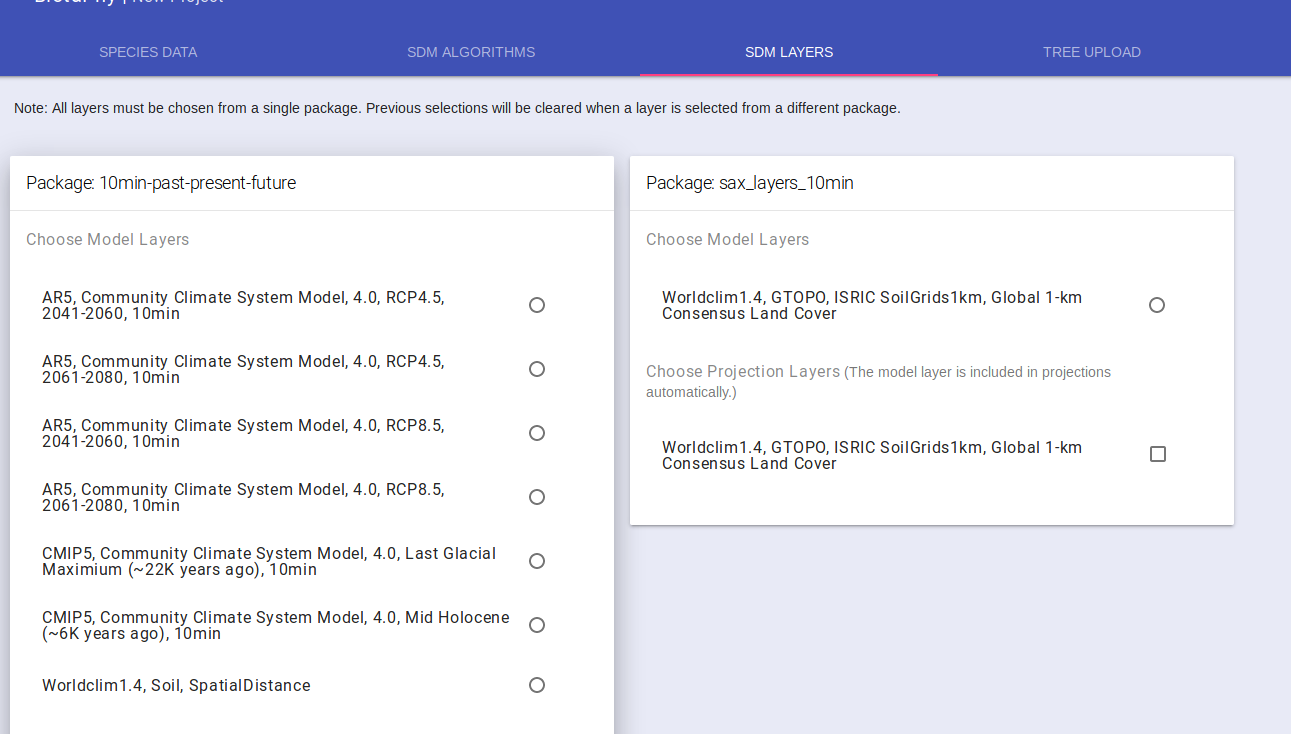
If you only want to perform SDMs, you can move on to Submit Project. If you wish to perform multi-species analyses, you may want to Upload a Tree.
Upload Phylogenetic Tree
If you wish to perform MCPA, or you want to include Phylogenetic statistics with the multi-species analyses, you will need to provide your tree. That can be done under the “TREE UPLOAD” tab. Browse to your tree file and select it.
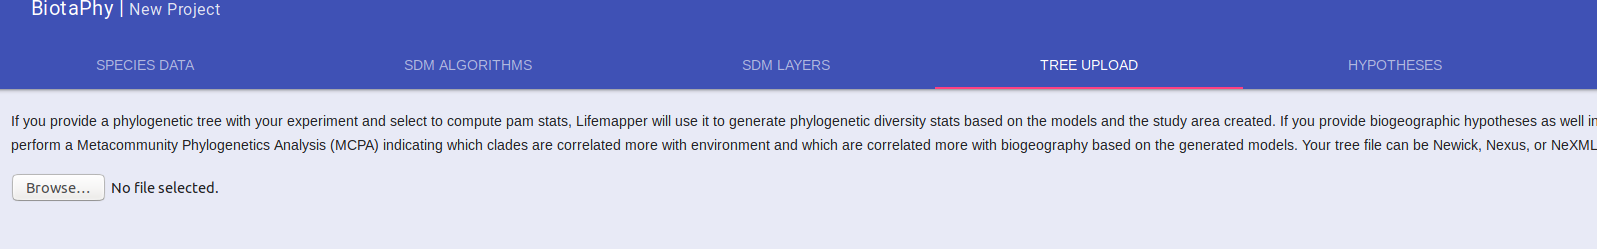
Like the occurrence data upload, a progress bar is displayed as your file is uploaded and a message indicating when it has been uploaded successfully will be displayed.
If you wish to compute MCPA, continue on to Add Hypotheses, otherwise, Submit Project.
Upload Biogeographic Hypotheses
To perform MCPA, you must provide biogeographic hypotheses. Select the “HYPOTHESES” tab and upload your hypotheses in a zip file.
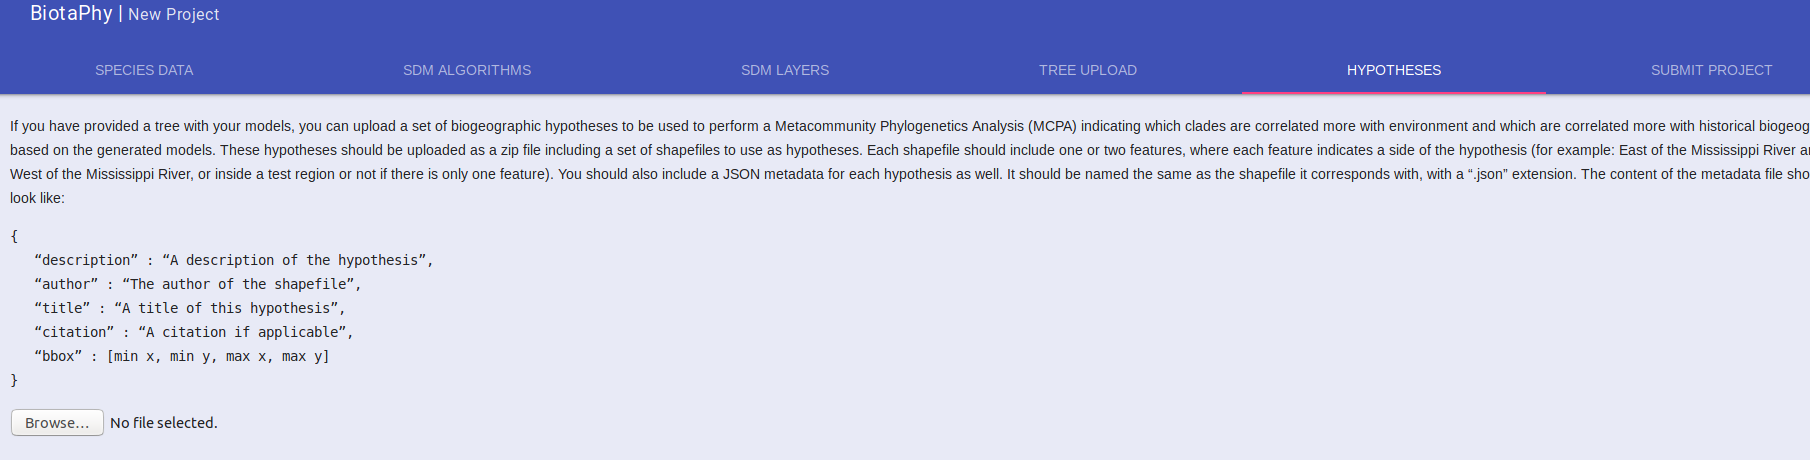
At this time, the hypotheses must be provided in a single zip file. In that zip file, each hypothesis should be included as a shapefile with one or two features. Shapefiles with one feature will be treated as hypotheses that look for data that is either in the feature, or not. If the shapefile has two features, the hypothesis will compare data that is in one feature versus data that is in the other. In either case, a matching JSON file must be included for each hypothesis that looks like:
{
   “description” : “A description of the hypothesis”,
   “author” : “The author of the shapefile”,
   “title” : “A title of this hypothesis”,
   “citation” : “A citation if applicable”,
   “bbox” : [min x, min y, max x, max y]
}
Let us know if you want help constructing your hypotheses and we would be happy to assist you.
After uploading your hypotheses, move on to Submit Project.
Submit Project
Finally, select the “SUBMIT PROJECT” tab. This tab shows you what data you have provided for your project. If you have run through the steps that I have listed, each of the check boxes should be checked. There is a final toggle for computing PAM stats. These statistics also include MCPA, so toggle that to on. The toggle will turn blue. Now click “SUBMIT PROJECT” to send your project configuration to the server. Note that if any of the check boxes are not checked, you will need to fill those in first. The easiest one to miss in my opinion is naming your project, so make sure you have done that.
Once you click submit project, you will see a message indicating that the project is being submitted. It may spin for a few seconds before changing the message to “Requesting status”. This indicates that the project is on the system and will run. The message will be updated as the status changes and the project moves in the line of computations. Depending on how long the line is and the computations in front of yours, this could take a while. User jobs should be moved to the front of the queue though so hopefully not too long. At this point, you can wait for your results or come back later.
If you choose to come back later, go to the same url: http://client.lifemapper.org/biotaphy and as long as you are still authenticated (indicated by your name in the left side) you will see your projects listed under the “New Project” link. A check mark next to the project name indicates that it has finished. An hour glass indicates it is still running and an exclamation point indicates that there was a problem. If you see an exclamation point, let us know and we will look into what may have gone wrong.
Once your project has completed, select it from the left side. It will take a few seconds to load your maps, but they should come back. You can browse them in the UI by panning and zooming to view the mapped data. Note that the maps are centered and may not show your projected data if it is near the extremes until you pan to it. You can select maps for specific species or page through them with the navigation options above the maps.
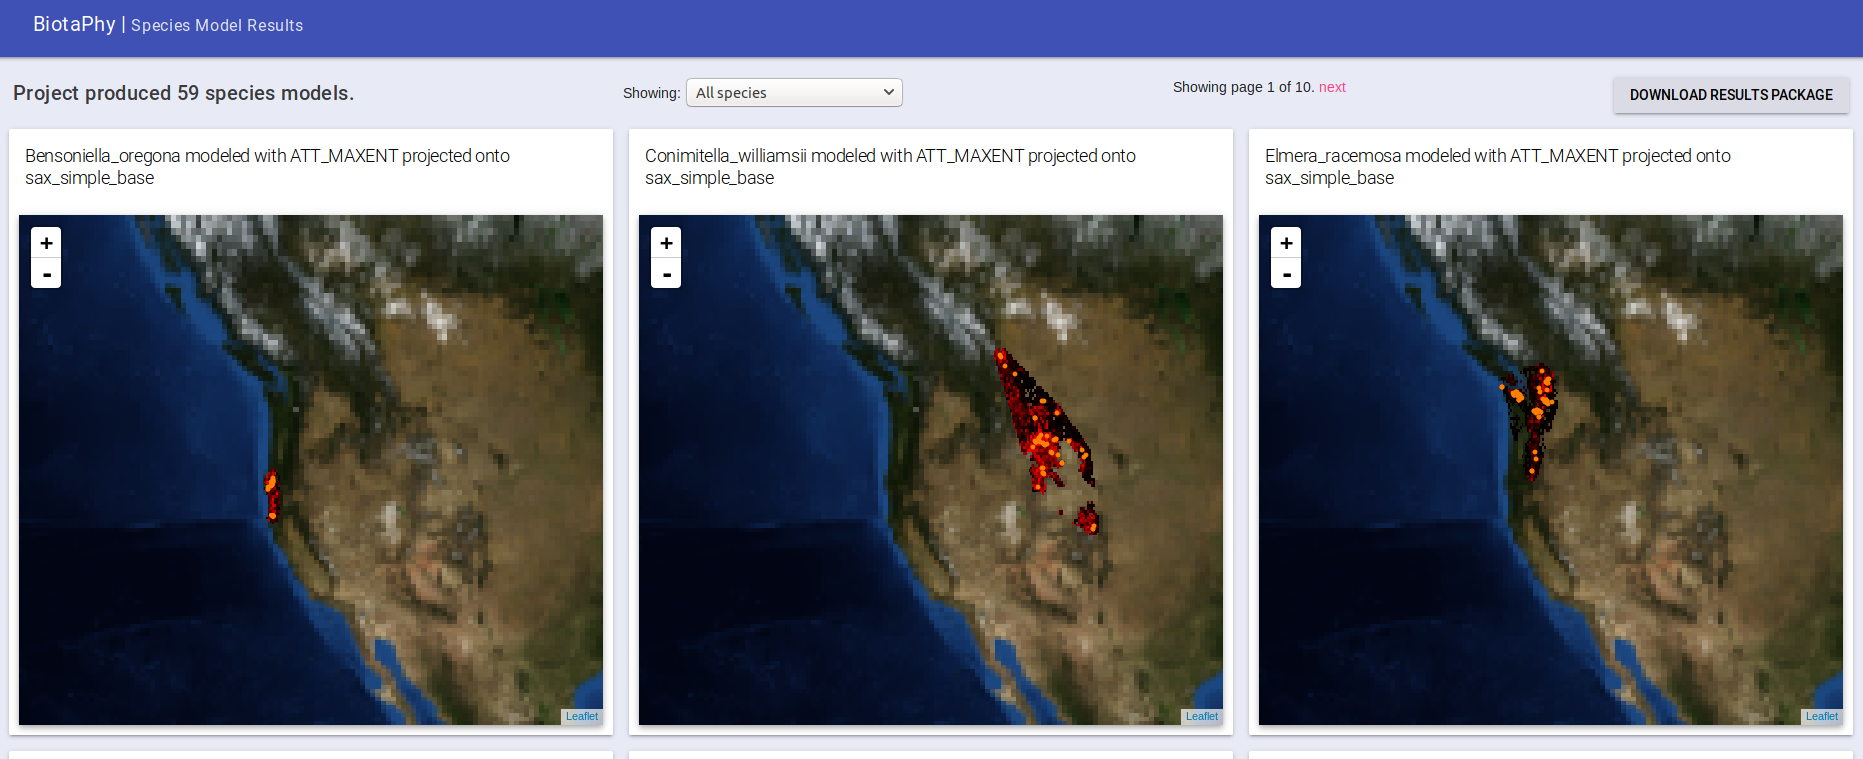
You can also download the output package form the “DOWNLOAD RESULTS PACKAGE” button. This will take some time to assemble all of your results (this will be sped up later so you don’t have to wait as long). That results package is what I have sent you previously for your earlier projects. Download that to have a local copy of the generated outputs.