biotaphy.github.io
BiotaPhy Project
Introduction. The BiotaPhy (“Biota-fy”) Platform is a species distribution and biodiversity modeling workflow environment. It is the product of a three-year research and development collaboration among iDigBio at the University of Florida, Lifemapper at the University of Kansas, and Open Tree of Life at the University of Michigan. The goal of the BiotaPhy Project is to create an extensible, stable, and technically-supported biodiversity community science gateway that makes it easy to utilize the massive and growing amount of species data digitized by biological museums through open APIs and in user-defined workflows that catalyze convergent research, and more broadly, impact education and workforce training in biodiversity informatics. The BiotaPhy Platform serves a public archive of species occurrence points for over 700,000 species from the Global Biodiversity Information Facility (GBIF), and computes and presents predicted distribution models for about a third of those - terrestrial species with at least 20 unique locations. The public archive includes models made using the Maxent algorithm for current, predicted past, and predicted future IPCC climate scenarios (IPCC 2014). The facility also enables researchers to request a suite of custom analyses on their own data, or by using iDigBio aggregated species occurrence data. With funding from the US NSF (BIO/DBI #1458422 and earlier awards), we extended the Platform’s workflows to include the assembly of multispecies data sets for macroecological analyses of biological diversity. We also extended the Platform’s analysis capabilities to include evolutionary evidence by integrating phylogenetic data and methods. And we scaled BiotaPhy’s capacity for biogeographic analyses based on species occurrence data by interfacing to XSEDE high-performance computing resources. The Platform now has the algorithmic and computational capacity to process occurrence data modeling and analysis runs for tens of thousands of species on continental- and global-scale spatial extents. The codebase consists of 65,000 lines of Python, plus 120,000 lines of other web code, templates, and configuration information. BiotaPhy software is open source, GPL3 licensed, and accessible from GitHub.
Cluster Configuration. The BiotaPhy Platform requires a physical or virtual compute cluster comprised of a “front end” machine and one or more compute nodes. The Platform is managed with Rocks software (Papadopoulos et al. 2003), a cluster management toolkit that extends CentOS, and uses “Rolls” to bundle software, dependencies, and scripts for portability and virtualization. Installations are automatically tuned for local resource availability. As a result of enforcing an underlying operating system and cluster architecture, we streamlined the platform, shortened the development cycle, and reduced code complexity (Williams et al. 2017). Consistent deployment allows us to test on a variety of differently configured virtual clusters.
Platform Architecture. The Platform comprises four functional subsystems (Fig. 1): 1) Data and Analysis Manager (DAM) accepts user data or retrieves data from online data providers (iDigBio, Open Tree of Life, and GBIF), preprocesses data sets, assembles workflows, and post-processes outputs; 2) Compute Manager handles work queues, job distribution, and execution; 3) Compute Engine performs the actual computations and produces raw results; and 4) Client Interfaces simplify user access to BiotaPhy tools and data and include the BiotaPhy web app, BiotaPhy APIs, and BiotaPhy Results Packages. Results Packages contain embedded visualization tools in downloadable, interactive, data packages. The web app is our user interface for browsing public archives of species models and for initializing modeling and analysis workflows. Users define workflows in tabbed browser pages to specify the modeling and analyses desired, select or upload species, environmental, or phylogenetic tree data, and then choose algorithms and parameters. Once a workflow is defined, the DAM marshals the inputs, initiates the job, and monitors it to completion. When analyses are complete, the DAM produces a downloadable, autonomous results exploration package (see below).
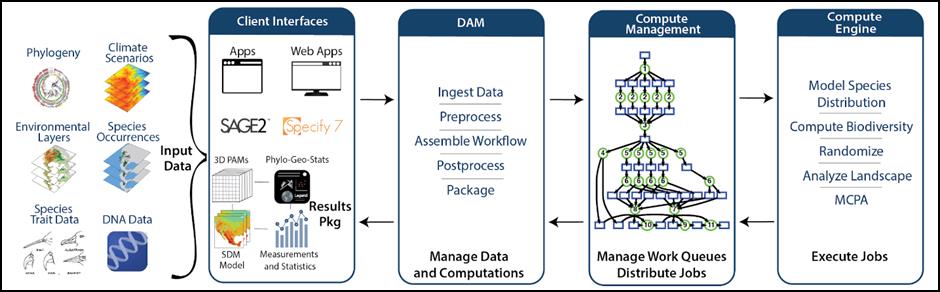
Figure 1. Functions of and communications between BiotaPhy subsystems. The Data Access Manager (DAM) responds to external user communications through Client Interfaces, then distributes data and jobs internally. Compute Management directs jobs to and from Compute Engine, the workhorse of the software.
The Compute Manager interfaces the DAM server with the Compute Engine. It defines and manages compute jobs using the Makeflow and Work Queue libraries from the Cooperative Computing Lab (CCL, Yu et al. 2010). These packages handle dependency management and complete computations using the master/worker paradigm, enabling workflows to scale simply by adding additional computational workers. We have worked with the CCL on extensions to their tools for challenges specific to BiotaPhy workflows, primarily for handling larger-scale and asymmetric computations.
Species Model Archive and Macroecological Analysis. The production installation of the BiotaPhy Platform is populated with GBIF species point occurrence data and modeled distributions for terrestrial plant and animal species. This model archive is web-accessible and is primarily useful for general browsing and casual discovery, but research use of the platform employs BiotaPhy’s capabilities for researcher-defined species modeling and analyses, typically using vetted, custom data. BiotaPhy’s interactive web application accepts uploaded files of species occurrence point data, range maps, or modeled species distributions as inputs for the creation of presence-absence matrices (PAMs). PAMs are binary matrices representing the actual or modelled incidence of species sorted into a geospatial grid of custom spatial scope and resolution. PAMs are used as input data sets for many types of biogeographical analyses; BiotaPhy’s distinctive contribution to PAM computing over other related software is with its unique set of analysis capabilities and its transformative compute scaling. Several integrated biodiversity informatics platforms have appeared in the last decade—e.g., Biodiverse (Laffan et al. 2010); Phytools (Revell 2012); Phylolink (Miller et al. 2018); and GeoDa (Anselin et al. 2006). BiotaPhy occupies a unique niche in the ecology/evolution software environment as many of these tools only perform a subset of BiotaPhy functions: acquiring and serving data, analyzing and visualizing results in an interactive environment. In addition, BiotaPhy’s scalable architecture allows it to handle very large analyses, such as thousands of species at high resolution for large geographic extents, by allowing installation on high-performance resources, like virtual clusters with multiple powerful compute nodes on San Diego Supercomputer Center’s XSEDE resource, Comet.
Scalable Performance Design. BiotaPhy’s compute architecture can routinely work with PAMs with millions or billions of cells, but with data sets of that size, traditional algorithms for randomizing PAMs for null hypothesis testing– such as Gotelli’s swap (Gotelli & Entsminger 2003)–break down (Sanderson & Pimm 2015). To handle massive PAMs, we developed an algorithm for true equal-probabilistic matrix randomizations that maintains required conditions for null hypothesis testing and takes advantage of parallelism to randomize PAMs in a fraction of the time required by the standard method (Grady et al. in prep). Now analyses that previously required days or weeks, complete in a few hours. Our capacity for computing with continental- and global-scale PAMs far surpasses earlier applications as we can efficiently perform robust permutation testing using a much larger number of randomizations.
As part of our network integration of the iDigBio, Open Tree of Life, and Lifemapper, we implemented a suite of multi-species and phylogenetic analyses that were made possible by the convergence of data from the three data communities. The BiotaPhy Platform now includes quantifications and qualifications of PAMs including calculation of Whittaker’s multiplicative beta, Lande’s additive beta, Legendre’s beta, richness-field of a species, dispersion-field of a species, matrix of covariance of composition of sites, matrix of covariance of ranges of species, mean composition covariance, mean range covariance, Schluter sites-composition covariance, Schluter species-ranges covariance, Wright & Reeves’ nestedness, and Stone & Roberts’ C-score (all enumerated in Soberon & Cavner 2015). We implemented Peres-Neto’s methodology for Meta-Community Phylogenetic Analysis (MCPA, Leibold et al. 2010), an approach to tease apart the effects of historical biogeography and environmental (ecological) filtering on contemporary spatial patterns of biological diversity.
Results Packages. To enable desktop/laptop review of modeling results without the need for a continuous BiotaPhy server connection, the Platform produces downloadable Results Packages as standalone browser-based apps containing all modeling results, including multi-species outputs, PAMs, various spatial statistics, MCPA results, and annotated phylogenetic trees. Visualization tools are embedded in the packages, including a tree navigator, statistical visualizations, heat maps, and correlation graphs (Fig. 2). The Results Package includes a phylogenetic tree browser, a geographical map of site diversity, and a scatter plot of various site-based or species-based statistics. Brushing data in one window highlights the same data points in linked displays, enabling visual exploration of species diversity patterns across evolutionary, ecological, and statistical dimensions.
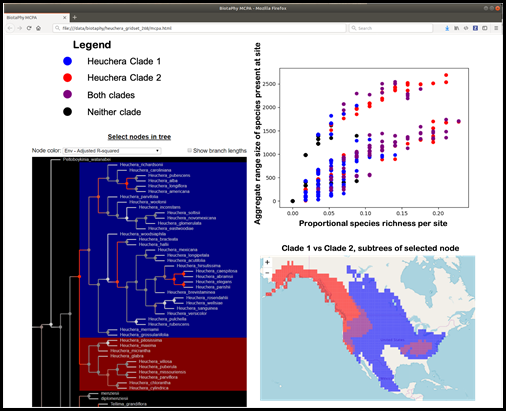
Figure 2. BiotaPhy Results Package display showing a linked visualization of some of the output data. In this example, the user has selected a node in the phylogenetic tree, highlighting the clades on either side of the chosen node (lower left). This results in highlighted areas in the map (lower right) showing the aggregated distributions of those same clades. Finally, the sites on the map are displayed in a plot of two statistics, Proportional species richness per site, and Aggregate range size for all species present in each site.
Literature Citations can be found here.
Interface Documentation for the project submission web interface can be found at https://biotaphy.github.io/web_client. Documentation for the results package can be found at https://biotaphy.github.io/results_package.
The BiotaPhy project is an open source software collaboration among iDigBio at the University of Florida, Lifemapper at the University of Kansas, and Open Tree of Life at the University of Michigan and is supported by U.S. NSF BIO/DBI Awards 1458640, 1458422, and 1458466 made to the three institutions, respectively.
![]()
![]()
![]()
Links:
Please visit our websites to see what we are doing and find out more about our projects:
- BiotaPhy Web Client
- BiotaPhy Web Client Documentation
- BiotaPhy Results Package Documentation
- Lifemapper GitHub Pages
Also check out our other code repositories on GitHub: